

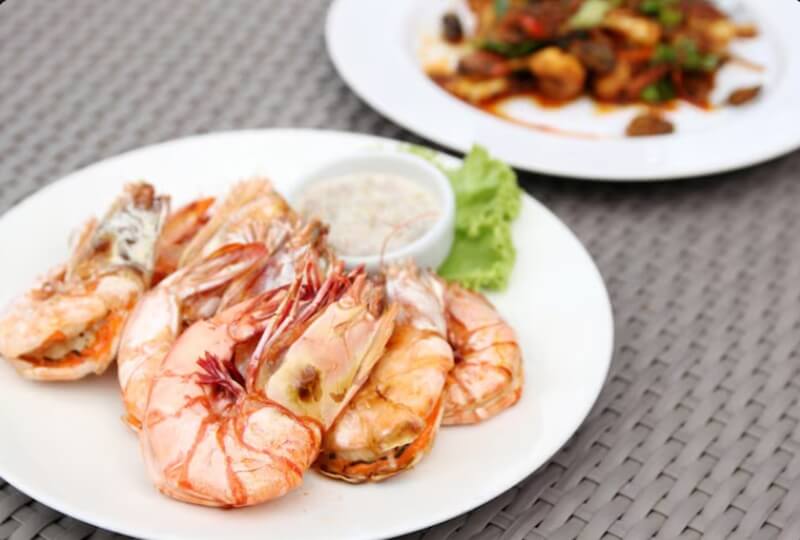
Shrimp has an almost ridiculous quality. It’s a critter that most people couldn’t draw from memory, but more than 20 years ago, it surpassed canned tuna as the most popular fish in America, and it never looked back. Nowadays, Americans consume more shrimp than tuna, cod, tilapia, and crab combined nearly six pounds per person per year. There is no slowing of that supremacy. The shrimp business is expected to grow from its current $80 billion to $131 billion during the next ten years. For an animal weighing a fraction of an ounce, those are numbers from the automotive sector.
Instead of a smooth growth slope, the charts show a far rougher story. Start with manufacturing. At 1.1 million metric tons annually, or about one third of all wild shrimp harvested from the ocean, China tops the world in wild shrimp landings. The majority of that catch, however, never leaves China. India, Ecuador, Indonesia, Vietnam, and Thailand are the main suppliers of shrimp that fill American freezers and restaurant baskets, roughly in that order. For ten years running, India has been the leading exporter to the United States; this trend appears to be stable for the time being.
| Category | Details |
|---|---|
| Industry | Global Shrimp (Wild Capture & Aquaculture) |
| Market Value (2024) | ~$79.6 billion |
| Projected Value (2033) | ~$131 billion |
| Growth Rate (CAGR) | 5.7% (2026–2033) |
| Dominant Species | Whiteleg shrimp (Litopenaeus vannamei) — 80% of farmed production |
| Top Producing Nations | China, India, Ecuador, Indonesia, Vietnam, Thailand |
| Top Importers | United States, Japan, European Union |
| Leading Companies | Thai Union Group, Minh Phu Seafood, CP Foods, Avanti Feeds |
| Key Certifications | ASC, BAP, MSC, Fair Trade |
| Global Wild Catch | ~3.3 million metric tons annually |
| Global Farmed Output | ~8 million metric tons annually |
| U.S. Per Capita Consumption | 5.9 lbs (peaked 2021); 38% of all U.S. seafood consumption |
| Reference | Sustainable Fisheries UW |
Interestingly, the only significant supplier that had a rise in shipments to the United States between 2022 and 2023 was Ecuador; other suppliers saw a decline in volume. Ecuador may have a subtle advantage over consumers who are interested in certification logos on the packaging due to its reputation for having a cleaner environment.
Wild shrimp is not nearly as big as farmed shrimp. Eighty percent of the nearly eight million metric tons of shrimp produced in 2023 were whiteleg shrimp, sometimes known as Pacific white shrimp or warm water shrimp depending on the retailer. The huge tiger prawn, once a darling in the industry, now only makes up 9% of the market.
It may be argued that tiger prawns have a deeper flavor and a more vibrant color. However, economics always prevails when it comes to packing whiteleg shrimp into ponds at densities that tiger prawns just cannot handle. The bags you pick up when you walk down the freezer section of any American grocery store are most likely whiteleg, which are grown in Southeast Asia or Latin America.
Sustainability ratings offer a stark perspective. Nearly 78% of the world’s wild prawn production hasn’t even been evaluated, according to the Certifications and Ratings Collaboration. Merely 7.8% possess an MSC certification. In other respects, the situation for farmed shrimp is worse in 2023, around 66% of the world’s farmed whiteleg production was rated as Seafood Watch Avoid .
A little more than 15% were certified as Fair Trade, BAP, or ASC. Although there is a perception that the sector is improving and it is, quantifiably the bulk of the food consumed worldwide continues to operate outside of what environmental organizations deem acceptable.
The biggest persistent issue with wild prawns is still bycatch. Small mesh nets are carried around the seafloor during shrimp trawling, and anything larger than a shrimp is swept up. Despite being one of the world’s best managed fisheries, the Gulf of Mexico fishery nonetheless has a 4.6 to 1 discard to landings ratio.
This means that about five pounds of other marine life, including fish, turtles, and young species, are collected and tossed back, frequently dead, for every pound of shrimp that is landed. No wild shrimp fishery has ever received a top tier Best Choice designation from the Monterey Bay Aquarium, despite gear modifications including turtle excluder devices. No matter how well management is done, conservationists are uncomfortable with this type of calculation.
The environmental burden of farmed shrimp is different but no less significant. Conservation International estimates that 40% of the world’s mangrove forests were destroyed due to the early growth of shrimp farming in tropical Asia and South America. Mangroves store biodiversity, filter water, and shield coastlines from storm surges.
In retrospect, it was a great deal to replace them with brackish shrimp ponds, even if the cost was much more than anyone realized at the time. Although recovery efforts are in progress, lost mangrove acreage does not regenerate on a quarterly earnings timeframe. Vietnam’s silvoculture initiatives, which directly integrate mangrove trees into shrimp farms, have received high sustainability grades.
The other ongoing issue is the use of antibiotics. Before shrimp is allowed to cross borders, the United States and other importing countries have strengthened regulations, requiring clean test results expressed in parts per billion. However, there are persistent allegations that some farms continue to employ prohibited treatments early in the rearing cycle,
timing it so that residues fall below measurable levels by harvest, while regulations differ between nations and enforcement is inconsistent. Despite being the world’s greatest producer, Chinese farmed shrimp hardly shows up in U.S. import statistics because to this method, which produces bacteria resistant to antibiotics.
The human cost is another. A 2015 Associated Press investigation linked the supply chains of big international retailers and restaurant brands to situations that amounted to modern slavery by exposing forced labor and child exploitation in Thailand’s shrimp processing industry.
The industry was affected by that reporting. Since then, social audits and labor norms have been included to certifications like BAP and ASC. In giving grants for seafood, the Packard Foundation has shifted its focus to justice and equity. However, in a sector where cheap labor is ingrained in the economic model, it is still uncertain if audits alone can uncover violations.
Another twist is added by the dynamics of commerce. Due to excess and slow demand in the foodservice industry, shrimp prices have dropped to almost all time lows. Farmers in the Soc Trang region of Vietnam, a center for shrimp cultivation and processing, are keeping shrimp in ponds for longer than usual in order to wait for better prices while the animals get bigger than any buyer has requested.
Domestic shrimpers in the American Gulf states are witnessing a decline in their standard of living due to their overhead costs, which prevent them from competing on price. Countervailing duties have been advocated by the American Shrimp Processors Association, which claims that nations such as Ecuador and India are dumping goods below fair value. The economics for producers on both sides of the issue could change depending on whether such duties are implemented.
Some promise for a more transparent future is provided by technology. Businesses like Aquaconnect in India and JALA Tech in Indonesia are using IoT sensors and AI driven analytics to monitor water quality, forecast disease outbreaks, and optimize feeding. This type of precision farming has the potential to increase survival rates while simultaneously reducing environmental impact.
Between 2023 and 2025, Aquaconnect reported a six fold increase in farmer onboarding. Even though it’s early, seeing these platforms grow seems like witnessing the first significant effort to introduce traceability to a sector that has benefited, in part, from opacity.
Shrimp are here to stay. Global demand is too ingrained in too many cuisine cultures, such as French paella, German stir fries, Japanese bento boxes, and American cocktail platters, to envisage a retreat. The market is still expanding. However, increase alone does not fully capture the complexity of the charts.
They depict a sector that is torn between cheap abundance and environmental responsibility, between advancements in certification and loopholes in enforcement, and between the promise of technology and human exploitation. The shrimp on your plate came from one of the world’s most convoluted food supply chains, and the truth is that most of us are unaware of which end of the chain we are consuming.
i) https://www.fred.stlouisfed.org/series/PSHRIUSDM
ii) https://www.gurufocus.com/economic_indicators/2854/global-price-of-shrimp
iii) https://www.fao.org/in-action/globefish/species-analysis/shrimps/en
iv) https://www.skyquestt.com/report/shrimp-market